17 Oct Microfluidic quantification of heterogeneity of bacterial populations
Abstract
“Severe non-healing infections are often caused by multiple pathogens or by genetic variants of the same pathogen exhibiting different levels of antibiotic resistance. For example, polymicrobial diabetic foot infections double the risk of amputation compared to monomicrobial infections. Although these infections lead to increased morbidity and mortality, standard antimicrobial susceptibility methods are designed for homogenous samples and are impaired in quantifying heteroresistance. Here, we propose a droplet-based label-free method for quantifying the antibiotic response of the entire population at the single-cell level. We used Pseudomonas aeruginosa and Staphylococcus aureus samples to confirm that the shape of the profile informs about the coexistence of diverse bacterial subpopulations, their sizes, and antibiotic heteroresistance. These profiles could therefore indicate the outcome of antibiotic treatment in terms of the size of remaining subpopulations. Moreover, we studied phenotypic variants of a S. aureus strain to confirm that the profile can be used to identify tolerant subpopulations, such as small colony variants, associated with increased risks for the development of persisting infections. Therefore, the profile is a versatile instrument for quantifying the size of each bacterial subpopulation within a specimen as well as their individual and joined heteroresistance.”

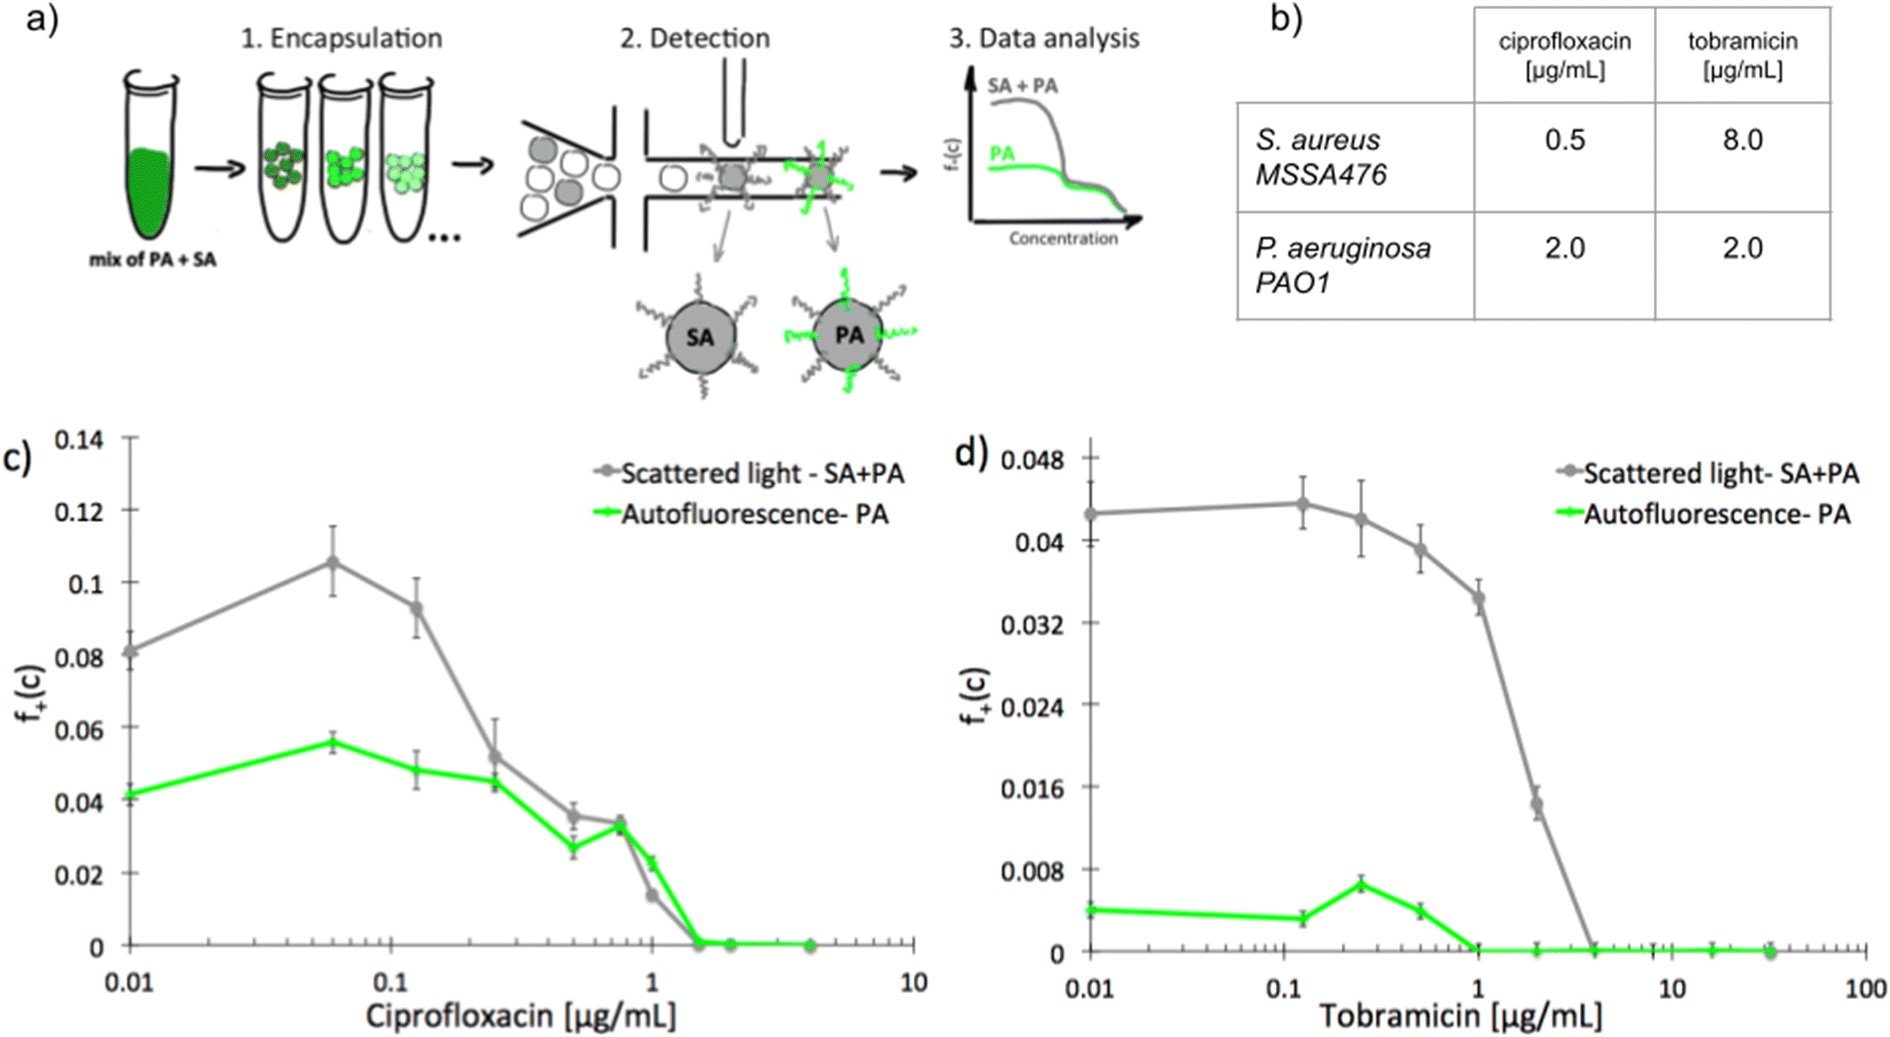
“Experimental determination of scMIC profiles of polymicrobial samples of pre-mixed S. aureus MSSA47 and P. aeruginosa PAO1; a) schematic overview of the workflow for label-free determination of scMIC profile, b) MIC values determined by standard microdilution method for ciprofloxacin and tobramycin against studied strains, c and d) scMIC profiles of pre-mixed samples determined as a fraction of positive droplets, a function of antibiotic concentration measured based on scattered light (grey line) and autofluorescence (green line) intensity.” Reproduced under Attribution 3.0 Unported (CC BY 3.0) from N. Pacocha, M. Zapotoczna, K. Makuch, J. Bogusławski and P. Garstecki, Lab Chip, 2022, Advance Article , DOI: 10.1039/D2LC00234E.
Figures and the abstract are reproduced from N. Pacocha, M. Zapotoczna, K. Makuch, J. Bogusławski and P. Garstecki, Lab Chip, 2022, Advance Article , DOI: 10.1039/D2LC00234E under Attribution 3.0 Unported (CC BY 3.0) license.
Read the original article: You will know by its tail: a method for quantification of heterogeneity of bacterial populations using single-cell MIC profiling


