20 Jan Droplet microfluidics for biomolecular condensate phase diagrams
Abstract
“The assembly of biomolecules into condensates is a fundamental process underlying the organisation of the intracellular space and the regulation of many cellular functions. Mapping and characterising phase behaviour of biomolecules is essential to understand the mechanisms of condensate assembly, and to develop therapeutic strategies targeting biomolecular condensate systems. A central concept for characterising phase-separating systems is the phase diagram. Phase diagrams are typically built from numerous individual measurements sampling different parts of the parameter space. However, even when performed in microwell plate format, this process is slow, low throughput and requires significant sample consumption. To address this challenge, we present here a combinatorial droplet microfluidic platform, termed PhaseScan, for rapid and high-resolution acquisition of multidimensional biomolecular phase diagrams. Using this platform, we characterise the phase behaviour of a wide range of systems under a variety of conditions and demonstrate that this approach allows the quantitative characterisation of the effect of small molecules on biomolecular phase transitions.”

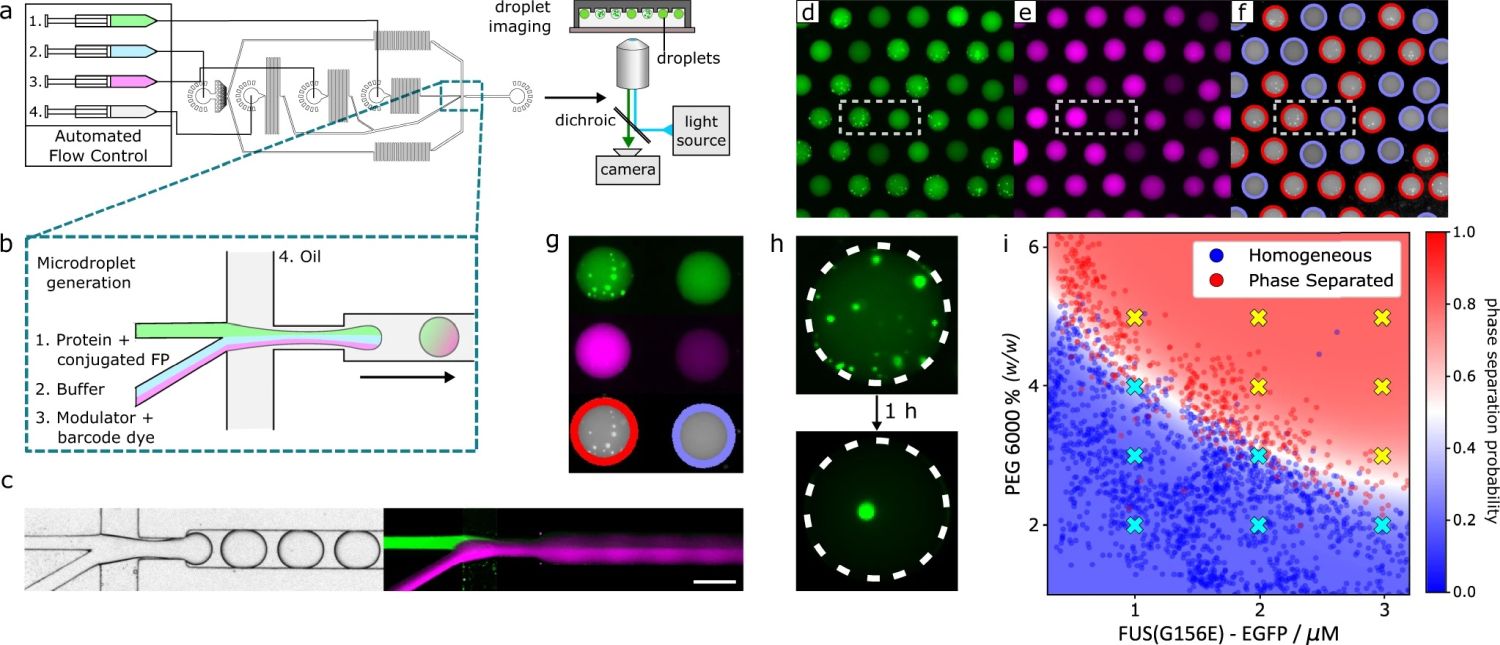
“a Droplets are generated using a flow-focussing microfluidic device controlled by automated syringe pumps and then imaged in wells by fluorescence microscopy. b At the droplet generating junction, aqueous solutions are combined under laminar flow before droplet formation. c Brightfield microscopy image of droplet generation (left) and combined fluorescence images of droplet generation (right) showing fluorescence of EGFP (green) and Alexa647 (magenta) barcodes for FUSG156E and PEG, respectively. d, e Epifluorescence microscopy images of trapped microdroplets, with EGFP and Alexa647 fluorescence corresponding to FUSG156E and PEG concentration, respectively. f Classification of droplets as phase separated (red outline) or homogeneous (blue outline) according to distribution of EGFP fluorescence. g Phase separated (left) and homogeneous (right) microdroplets imaged according to EGFP (top) and Alexa647 fluorescence (middle) and subsequent phase separation classification (bottom). Images correspond to the highlighted regions in (d–f). h Liquid condensates merge over time in microdroplets. i Phase diagram of EGFP-FUSG156E vs. PEG 6000 concentration, 50 mM Tris pH 7.4, 150 mM KCl. Red and blue data points in the scatter plot correspond to individual microdroplets classified as phase separated or homogeneous, respectively. The heat map corresponds to the probability of phase separation as determined by an SVM classifier trained on the droplet scatter plot. N = 2754 droplets. Yellow and cyan crosses correspond to phase separated and homogeneous behaviour as determined by manual pipetting experiment. Source data are provided as a Source Data file. Parts of this figure are reproduced with permission from Geiger et al.12.” Reproduced under a Creative Commons Attribution 4.0 International License from Arter, W.E., Qi, R., Erkamp, N.A. et al. Biomolecular condensate phase diagrams with a combinatorial microdroplet platform. Nat Commun 13, 7845 (2022).
Figures and the abstract are reproduced from Arter, W.E., Qi, R., Erkamp, N.A. et al. Biomolecular condensate phase diagrams with a combinatorial microdroplet platform. Nat Commun 13, 7845 (2022). https://doi.org/10.1038/s41467-022-35265-7 under a Creative Commons Attribution 4.0 International License.
Read the original article: Biomolecular condensate phase diagrams with a combinatorial microdroplet platform


